Hioki's Powder Impedance Measurement System is equipped with a compact-designed compressing mechanism and thickness measurement mechanism in addition to highly accurate electrical measurement capabilities. The system's compact design allows the press unit to be installed in a low dew-point environment, such as a glove box, so measurements can be safely performed without concerns for a risk of hydrogen sulfide gas leakage and material alteration.
Key Features
- Simultaneously measure impedance, thickness, and pressure
- Accurate analysis: calculate bulk density and ionic conductivity with precision
- All-in-one glove box operation: from loading to pressing & measurement, all tasks completed safely inside
- Enhanced safety: prevents hydrogen sulfide gas leakage & preserves material integrity
- Time-saving efficiency: no sample removal required—streamline the entire process
- Optimized testing: measure multiple conditions on a single sample continuously
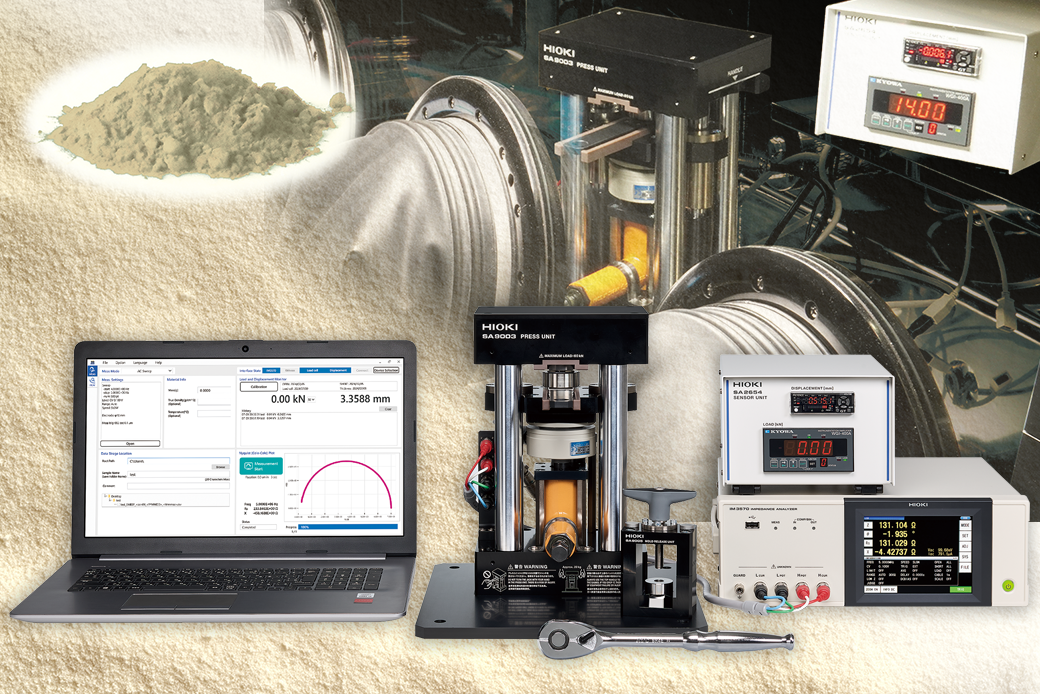
System configuration
Proper evaluation of the mechanical and electrical properties of powder materials
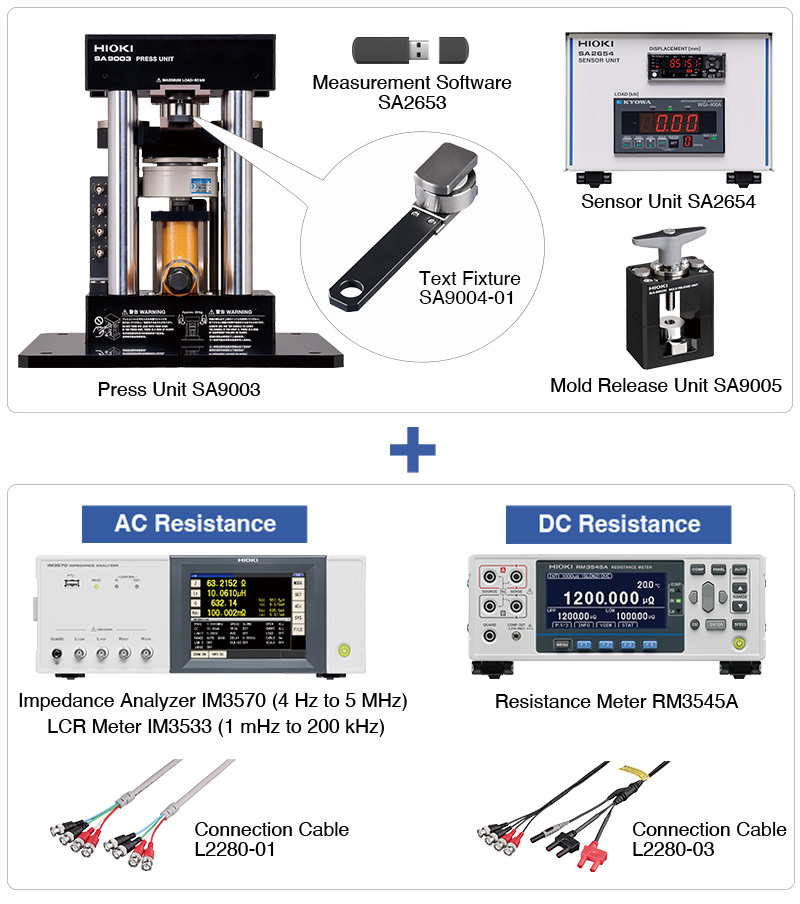
To properly evaluate the mechanical and electrical properties of powder materials, all mechanisms and software are designed in-house at Hioki.
- Measurement software that integrates the measurement data
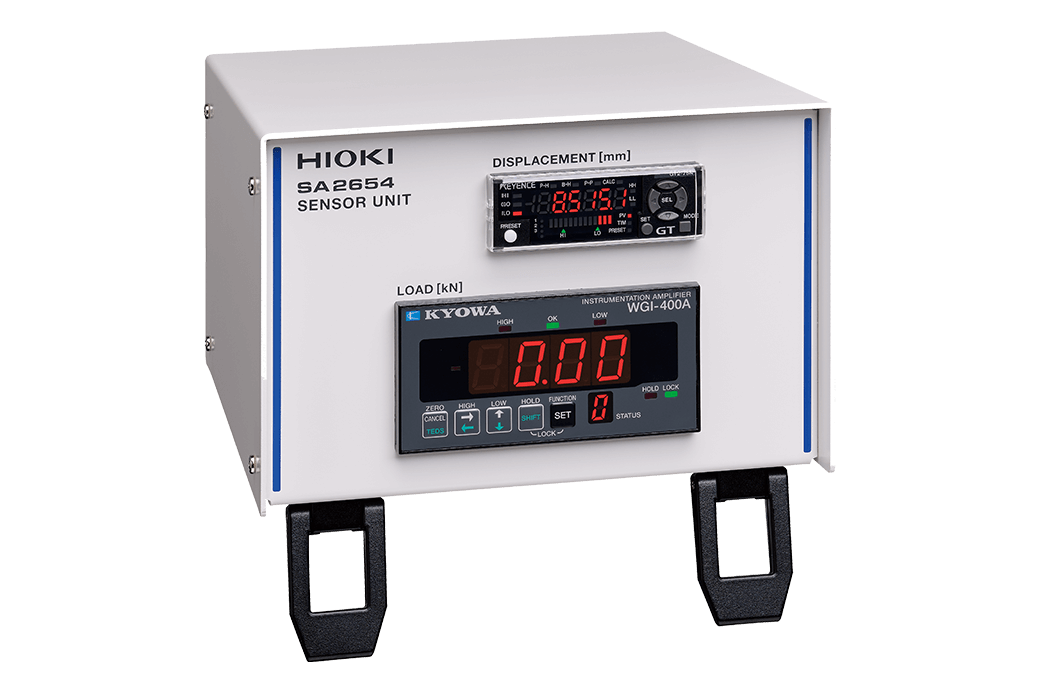
- Sensor unit that monitors pressure and displacement
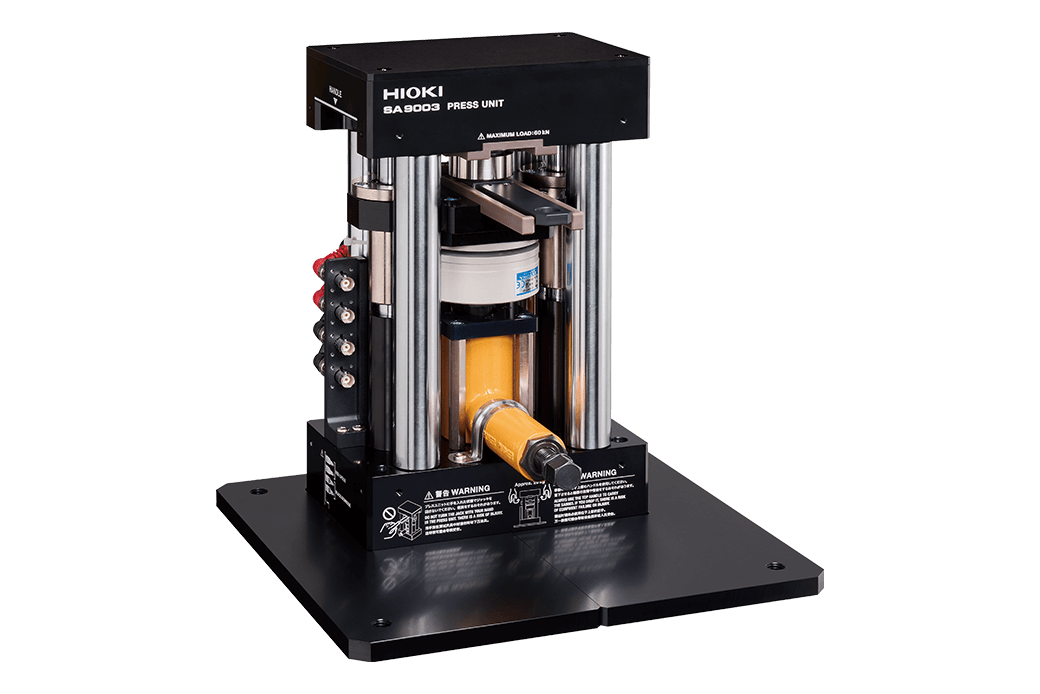
- Compact press unit with a built-in pressing mechanism, load cell, and displacement gauge
- High-intensity test fixture for filling powder materials
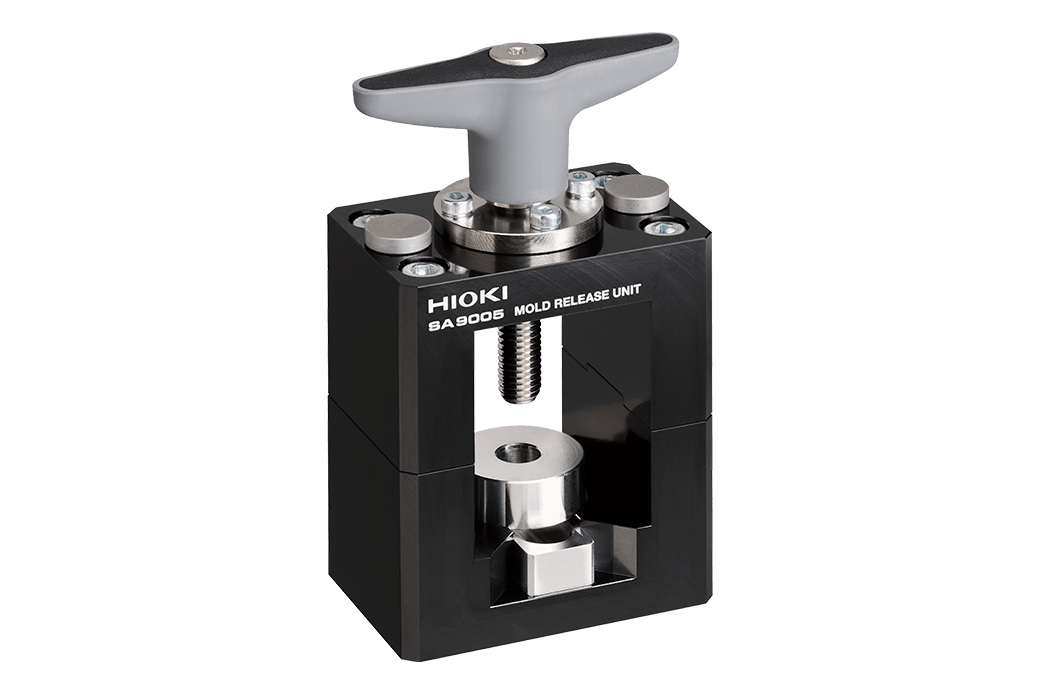
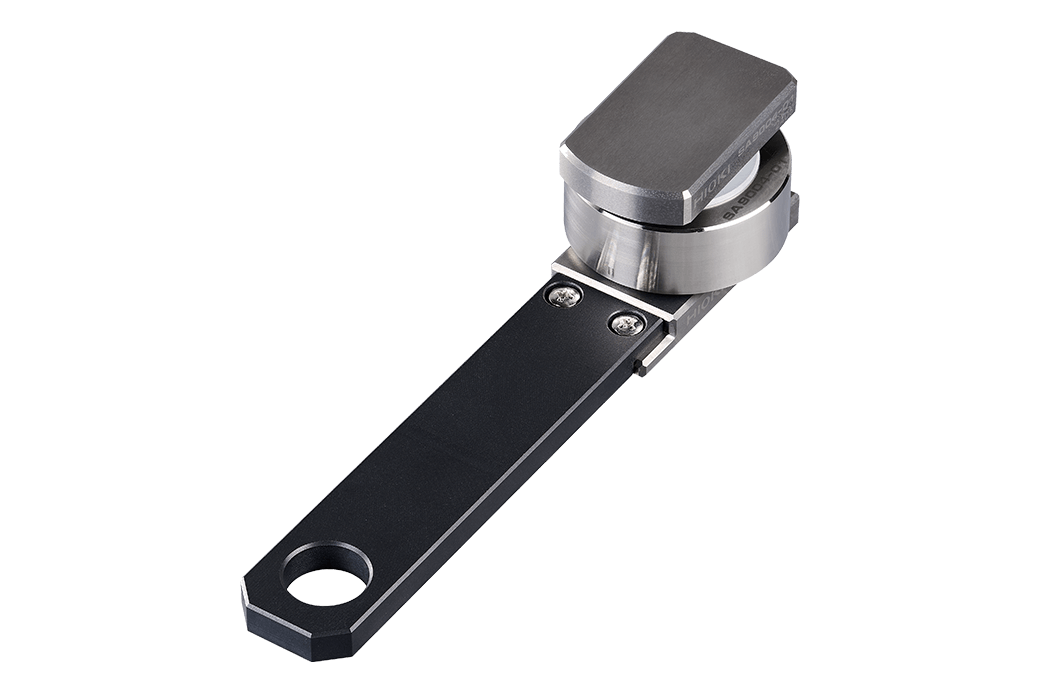
- Mold release unit for removing the pressed powder
Depending on the measurement target, you can select either AC resistance measurement or DC resistance measurement supported instruments:
- Solid electrolytes -> AC resistance measurement
- Conductive auxiliaries -> DC resistance measurement
By combining three types of measuring instruments, the system covers a wide measurement frequency range of DC, 1 mHz to 5 MHz.
All-in-one glove box operation
The compact-size SA9003 Press Unit allows it to be installed inside the glove box. This enables the entire process, from material loading to powder pressing and measurement, all tasks to be completed safely inside the glove box. For dimensions, please refer to the specifications.
The length of the connection cable between the SA9003 Press Unit and the measuring instrument is 80 cm.
(30 cm between the measuring instrument and BNC flange, and 50 cm between the BNC flange and press unit)
Two USB cables (A-B type) are included as accessories with the system.
For more details, please contact your distributor.
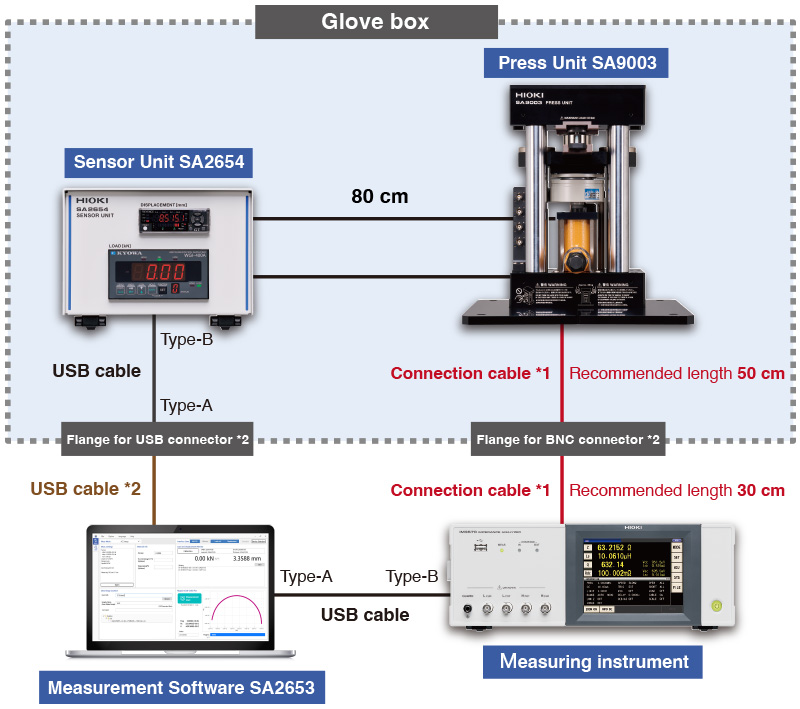
Notes in the figure
- *1:Custom orders are available.
- *2:Please prepare it yourself or consult your distributor.
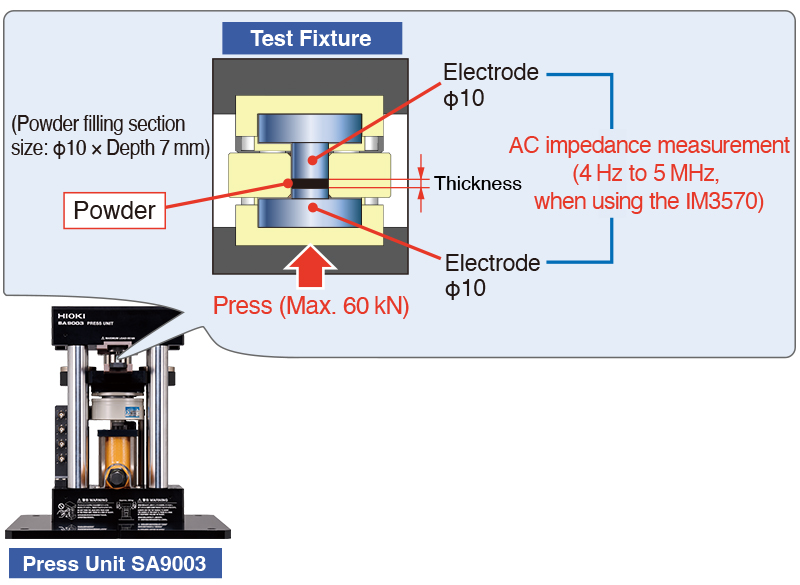
Measuring principle
How the measurement works
The impedance measurement method of this system is the 2-terminal method.
AC impedance measurements are conducted between electrodes with a diameter of 10 mm, placed above and below the powder.
Since the electrode is also subjected to high-pressure, they are made of a high-intensity cemented carbide, which is also used in powder molding.
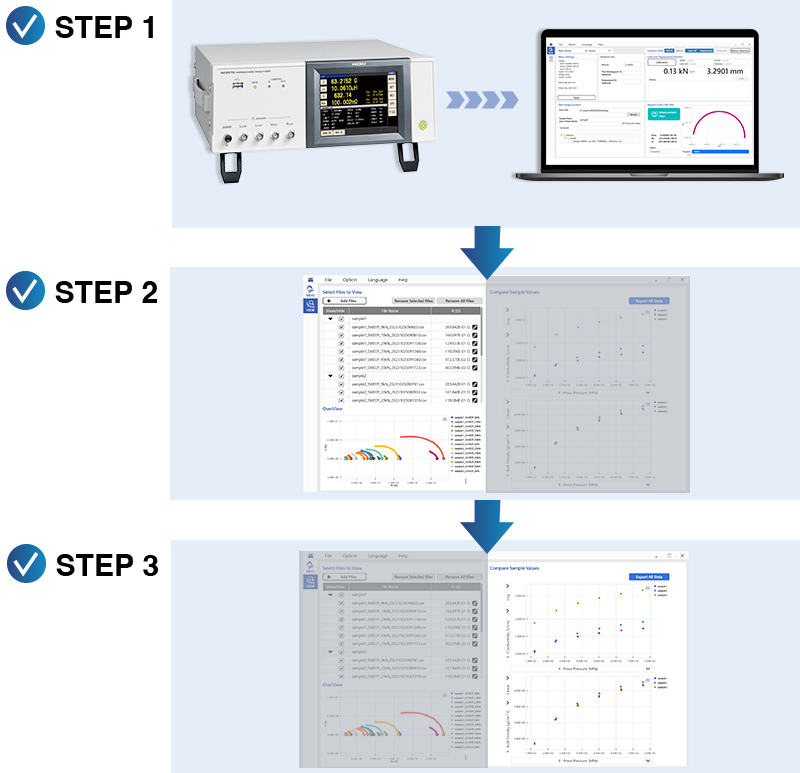
Graphing capabilities
Visualize results with built-in graphing functions for in-depth analysis
The dedicated software includes both measurement function and Viewer function.
Therefore, you can instantly compare data between samples once the measurement is complete.
STEP 1: Simultaneously acquire impedance, thickness, and pressure data.
STEP 2: Calculate the overall resistance from the measured impedance data. Based on the overall resistance, ionic conductivity, conductivity, and volume resistivity are calculated.
STEP 3: Using the Viewer function, you can create graphs for any selected parameters and compare data between samples.
| X-axis |
Load (kN), pressure (MPa), bulk density (g/cm3), filling factor (%) *3, porosity (%) *3 |
| Y-axis |
Impedance (Ω), volume resistivity (Ωcm), conductivity (s/cm), ionic conductivity (s/cm), relative permittivity (F/m) *4, bulk density (g/cm3), thickness (mm), filling factor (%) *3, porosity (%) *3 |
- *3:Only when the true density is entered.
- *4:Only for specific frequency measured in AC Continuous mode.
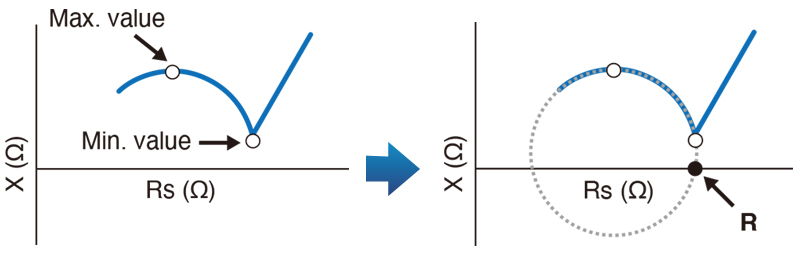
Automatic calculations: Easily calculate overall resistance (R) with Nyquist plot fitting
The maximum and minimum X (Ω) values are automatically extracted from the arcs of the Nyquist plot.
Circle fitting is performed on the data between the extracted maximum and minimum values, and the intersection with the X-axis is used to determine the overall resistance value R.
Basic specification
| Frequency at which measurements can be made |
DC to 5 MHz (Three types of measuring instruments used) |
| Load application method |
Manual operation (constant control of load is not possible) |
| Load range (compressing range) |
0 to 60 kN
(0 to 764 MPa, when using the SA9004-01 Test Fixture electrode φ10 mm) |
| Load measurement accuracy |
±3% f.s. |
| Thickness measurement error |
±10 µm
(under a constant temperature environment, after calibration is performed)
(within a load range of 10 kN to 60 kN, only with increasing load) |
| Electrode size |
φ10 mm (SA9004-01) |
| Powder filling section size |
φ10 mm, depth: 7 mm |
| Operating temperature and humidity range |
23°C ±5°C (73°F ±9°F), 80% RH or less (non-condensing) |
| Rated supply voltage |
100 V to 240 V AC
(SA2654, IM3570, IM3533, RM3545A) |
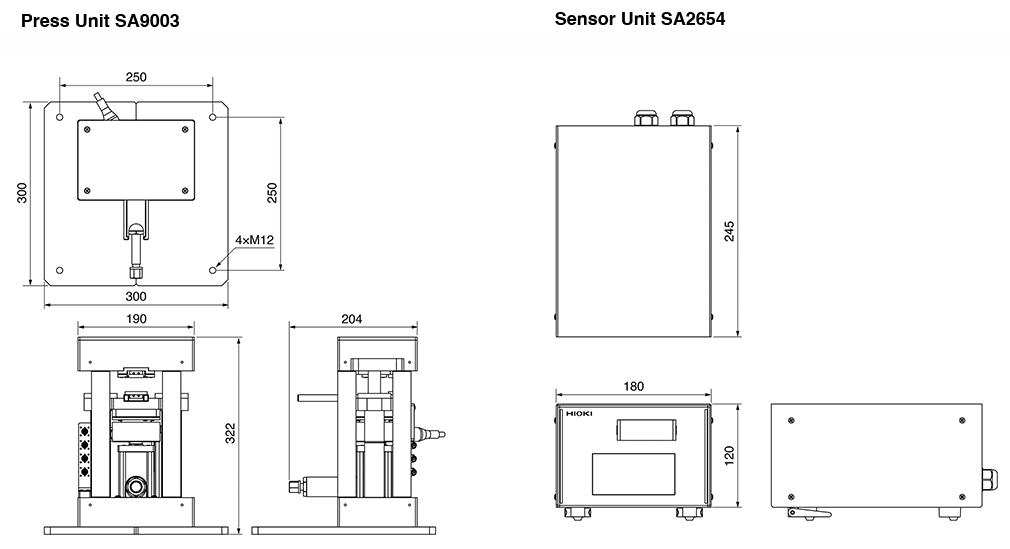
| Dimensions and weight |
Dimensions: see Fig. 1
Weight: SA9003 approx. 20.7 kg (45.6 lb.), SA2654 approx. 2.3 kg (5.1 lb.) |


 Calibration
 HVAC/Clean Rooms
 Electrical
 Temperature Meters
 Power & Energy
 Mechanical & Maintenance
 Pharma, Health & Biomedical
 Drone Solution
 Networking
 Transformer & Relay Testing
 Insulation, Resistance and Battery
 Fault Testing & Diagnostics
 Lightning Protection Solution
 Education, Research & Development
 Civil Equipment
 Renewable Energy
 Cleaning and supplies
 Power Tools
 Safety Tools
 Hardwares
 Construction Supply
 Stationeries
 Garden Tools
 Accessories
 Machines
 Hand Tools